ESG Data
Environment
CO2 Emissions
|
Scope |
FY2024 | FY2025 | FY2026 | |
|---|---|---|---|---|
| Scope1 (t-CO2) | Consolidated | 624 | 634 | 486 |
| Scope2 (t-CO2) | 8,966 | 7,921 | 7,934 | |
| Scope3 (Category1) (t-CO2) | 156,523 | 127,836 | 140,128 | |
| Scope3 (Category2) (t-CO2) | 8,806 | 32,402 | 17,195 | |
| Scope3 (Category3) (t-CO2) | 13,222 | 7,406 | 7,801 | |
| Scope3 (Category4) (t-CO2) | 3,442 | 3,433 | 3,682 | |
| Scope3 (Category5) (t-CO2) | 267 | 241 | 230 | |
| Scope3 (Category6) (t-CO2) | 532 | 475 | 450 | |
| Scope3 (Category7) (t-CO2) | 1,895 | 1,719 | 1,607 | |
| Scope3 (Category8) (t-CO2) | 0 | 0 | 0 | |
| Scope3 (Category9) (t-CO2) | 488 | 274 | 265 | |
| Scope3 (Category10) (t-CO2) | 0 | 0 | 0 | |
| Scope3 (Category11) (t-CO2) | 615,919 | 562,443 | 540,676 | |
| Scope3 (Category12) (t-CO2) | 17,917 | 17,041 | 16,455 | |
| Scope3 (Category13) (t-CO2) | 0 | 0 | 0 | |
| Scope3 (Category14) (t-CO2) | 0 | 0 | 0 | |
| Scope3 (Category15) (t-CO2) | 0 | 0 | 0 | |
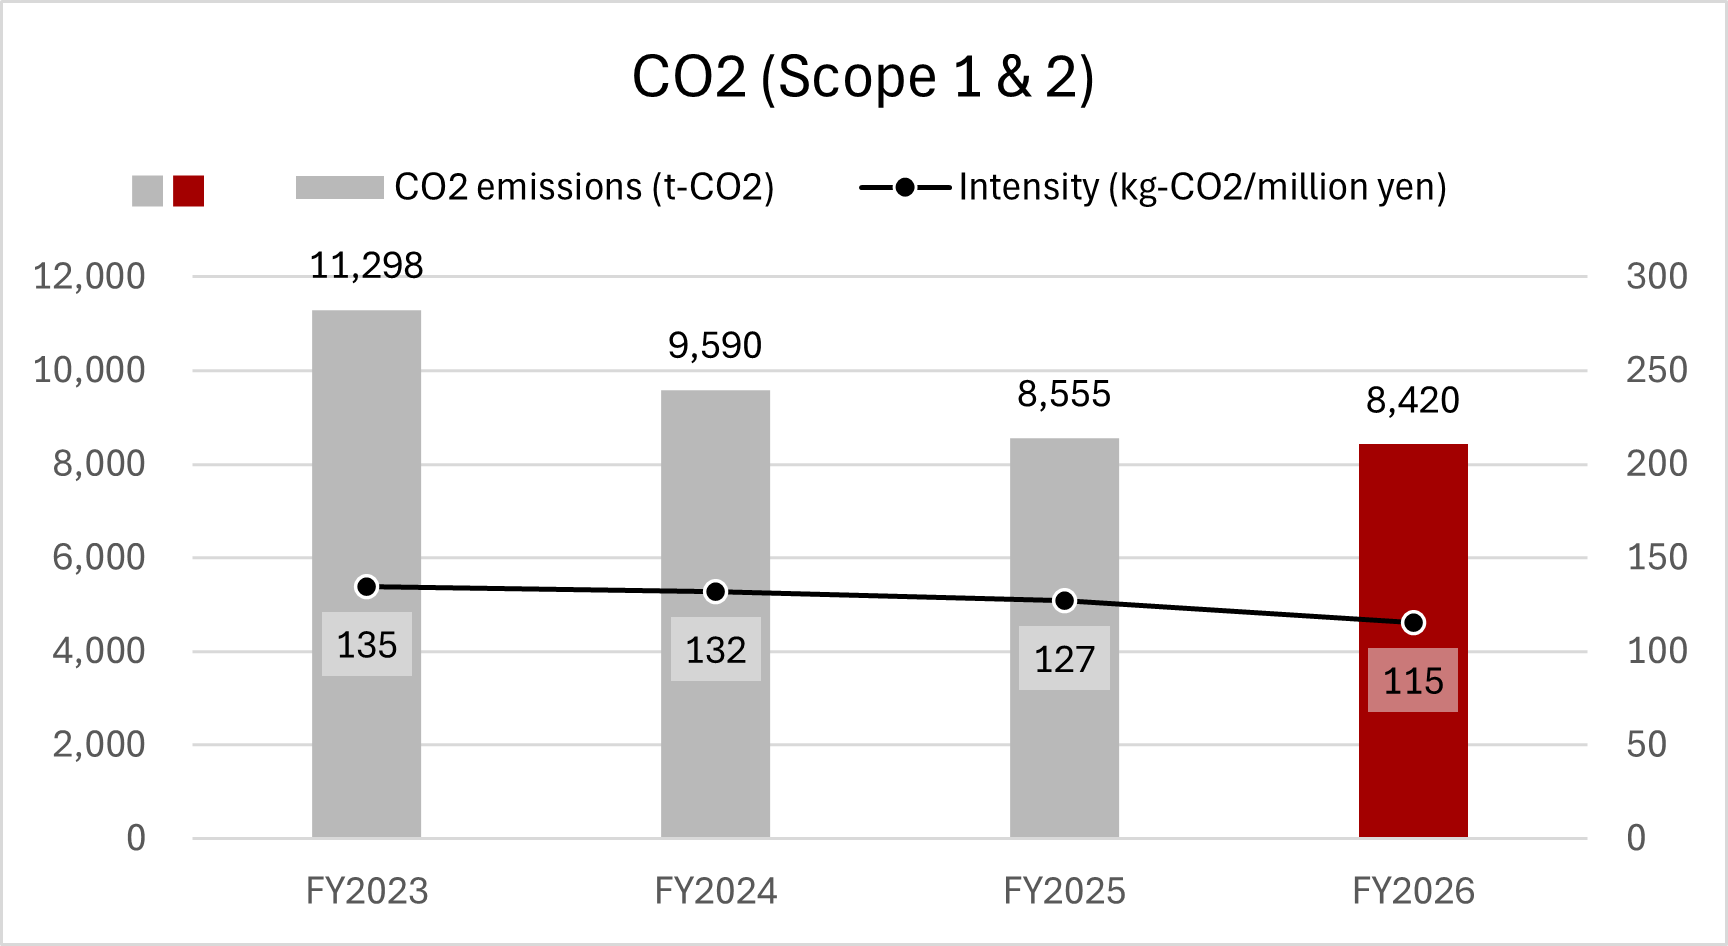
| In-house CO2 emissions (t -CO2) / intensity (kg-CO2/million yen) | 9,590 / 132 | 8,555 / 127 | 8,420 / 115 | |
| ROC (million yen/1,000 t-CO2) | 654 | 427 | 727 |
CO2 Scope 1 & 2
Energy Overview
|
Scope |
FY2024 | FY2025 | FY2026 | |
|---|---|---|---|---|
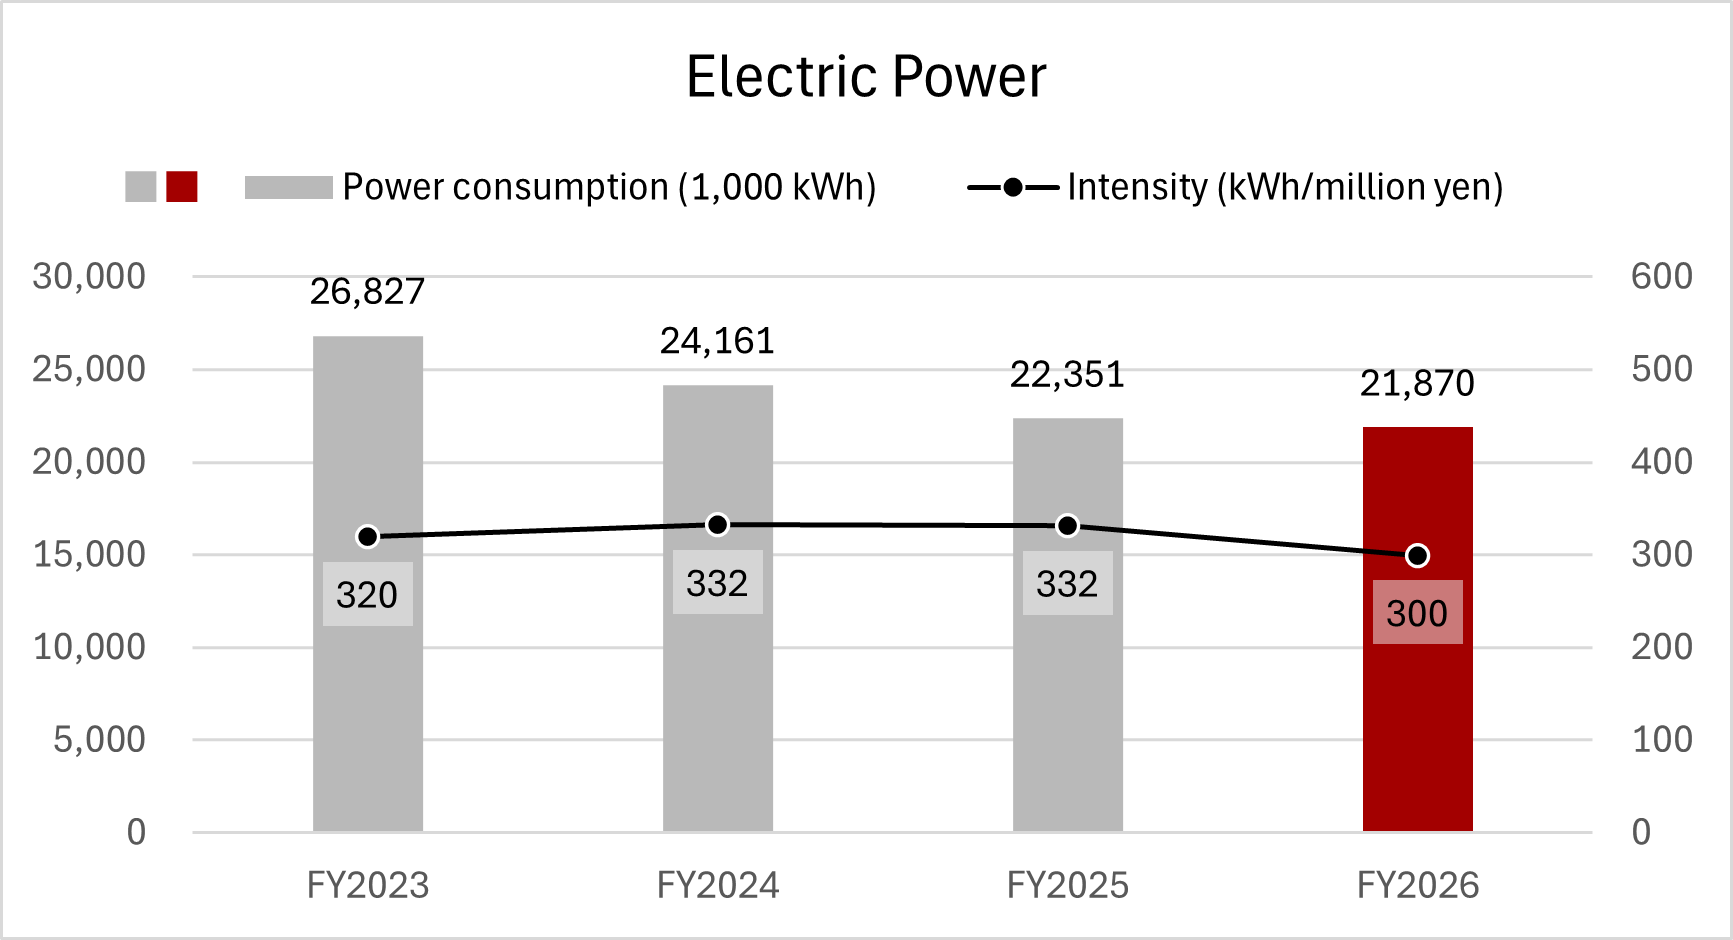
| Power consumption (1,000 kWh) | Consolidated | 24,161 | 22,351 | 21,870 |
| Solar power generated in-house: total (1,000 kWh) | 20,464 | 23,851 | 18,293 | |
| Solar power generated in-house: portion self-consumed (1,000 kWh) | 963 | 1,038 | 1,088 | |
| Renewable energy purchases (1,000 kWh) | 2,534 | 2,425 | 3,040 | |
| Renewable energy usage | 14.5% | 15.5% | 18.9% |
Electric Power
Waste Generation & Resource Recycling
|
Scope |
FY2024 | FY2025 | FY2026 | |
|---|---|---|---|---|
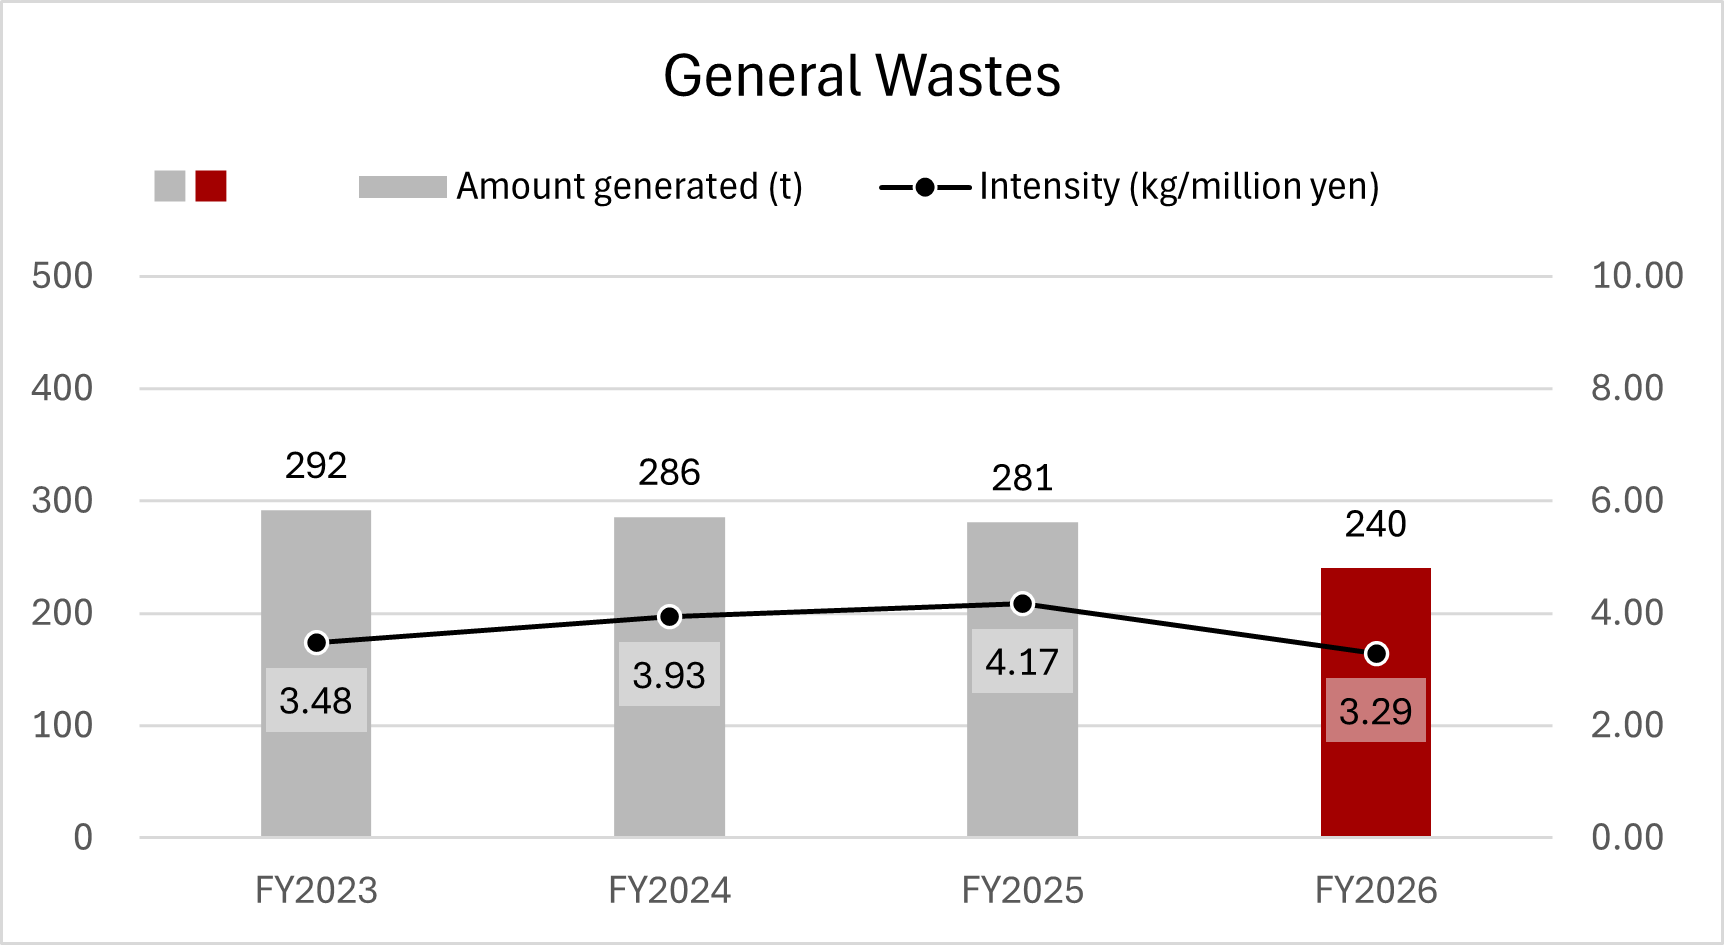
| General waste generated (t) / intensity (kg/million yen) | Consolidated | 286 / 3.93 | 281 / 4.17 | 240 / 3.29 |
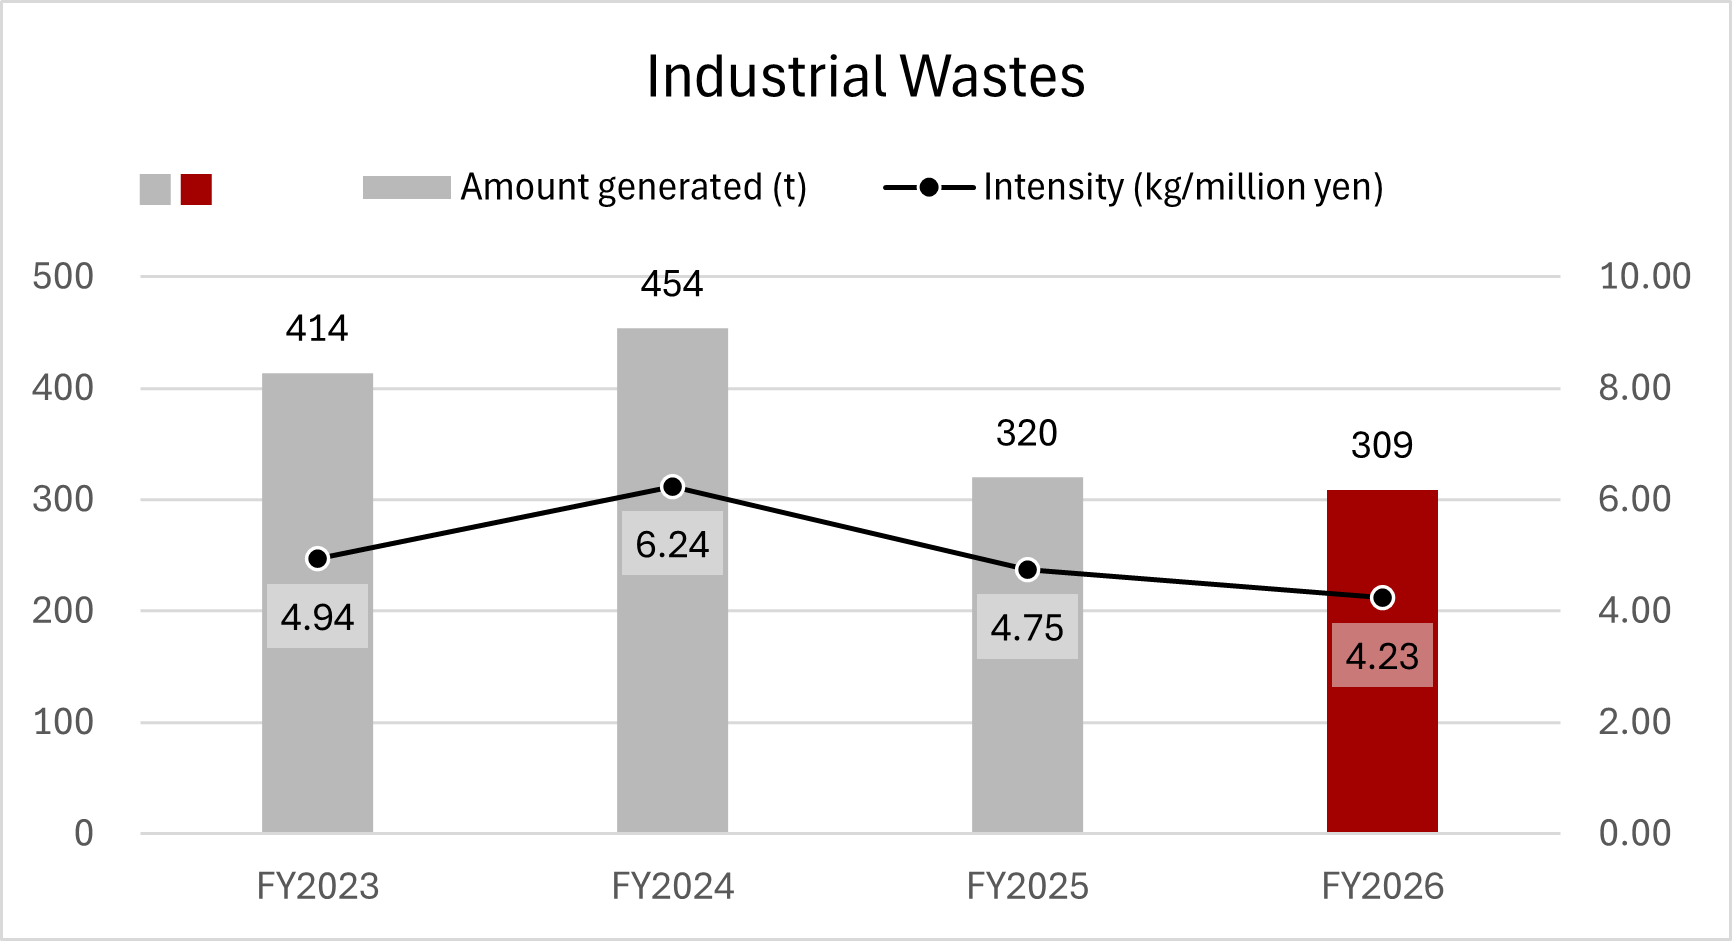
| Industrial waste generated (t) / intensity (kg/million yen) | 454 / 6.24 | 320 / 4.75 | 309 / 4.24 | |
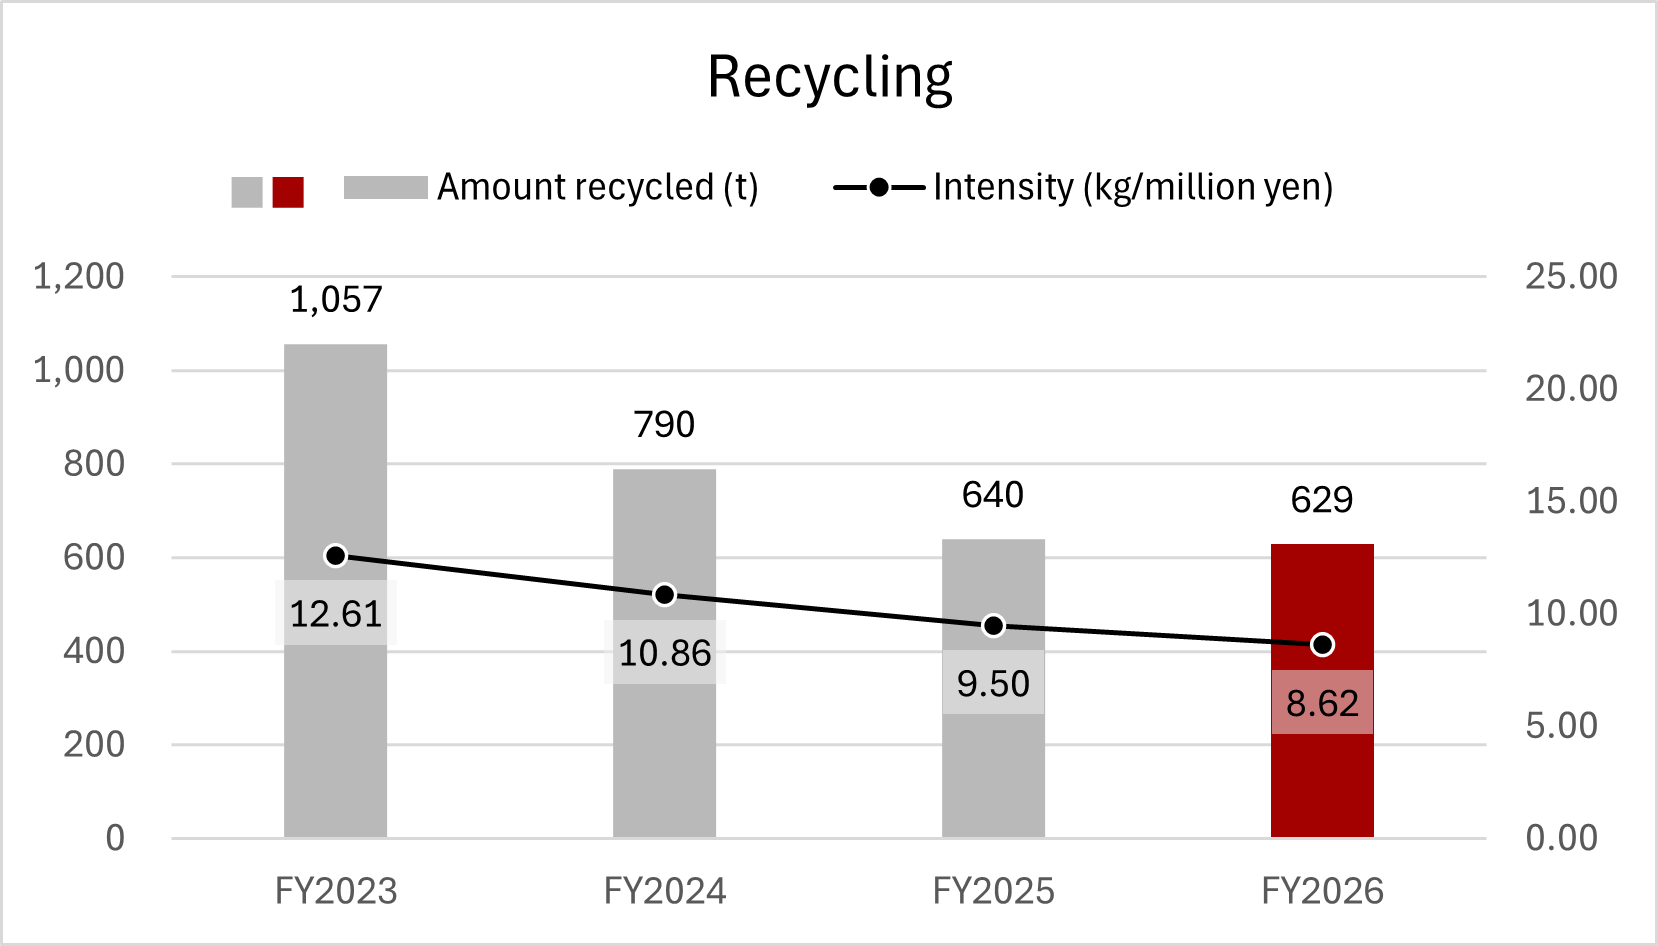
| Material recycled (t) / intensity (kg/million yen) | 790 / 10.86 | 640 / 9.50 | 629 / 8.62 | |
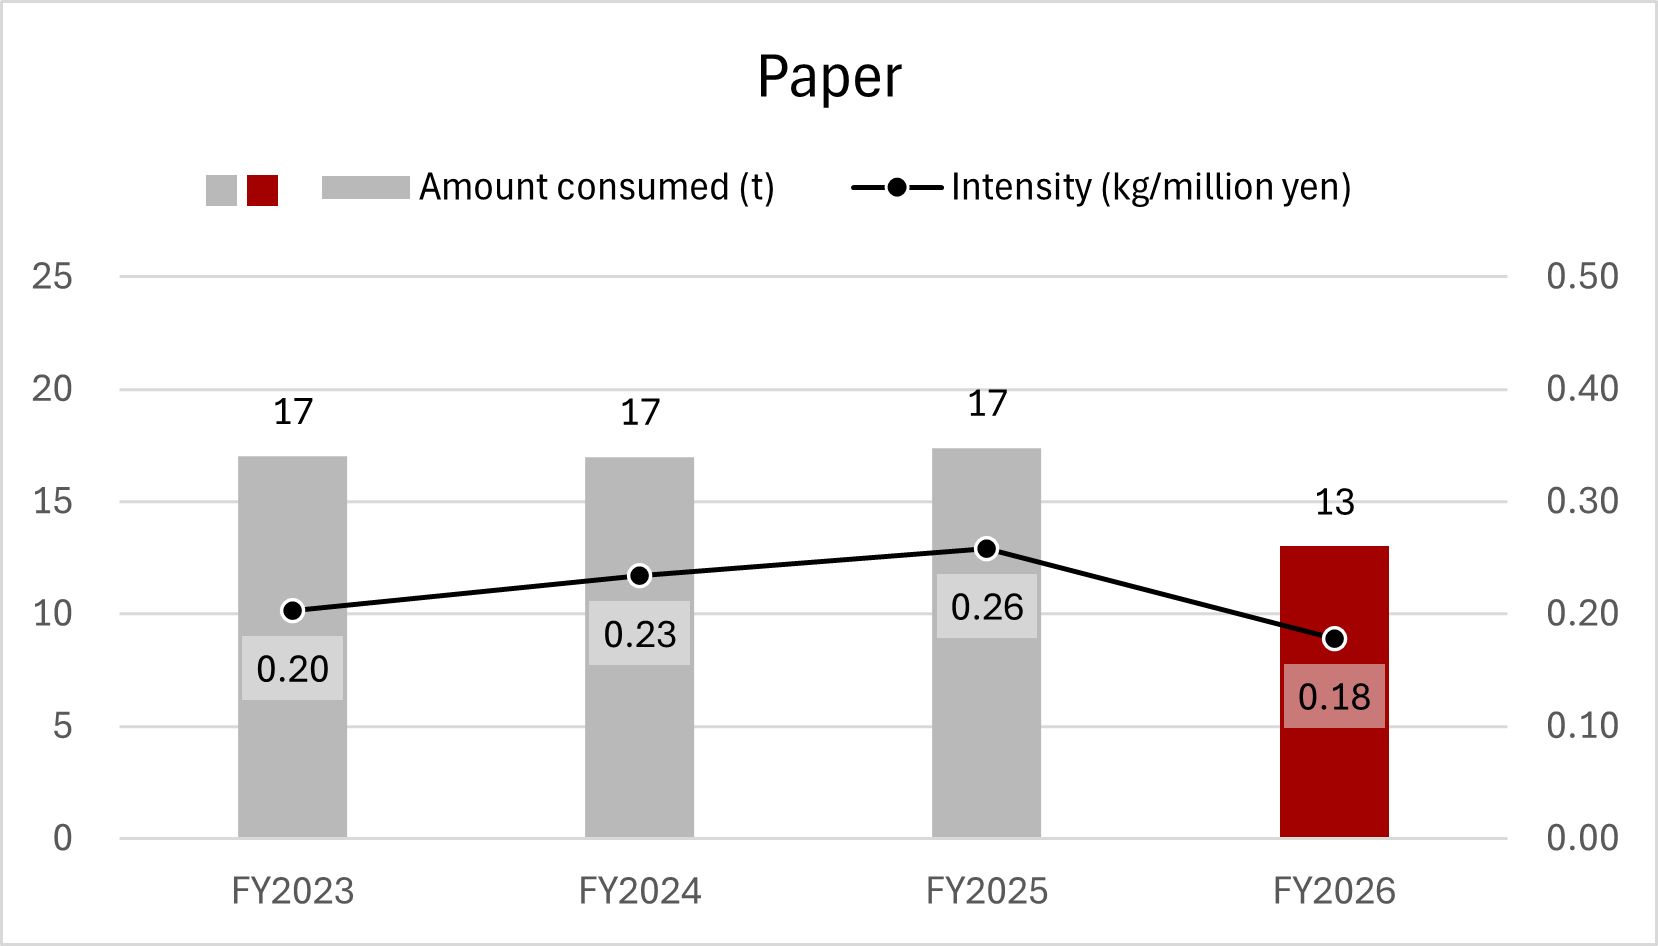
| Paper consumption (t) / intensity (kg/million yen) | 17 / 0.23 | 17 / 0.26 | 13 / 0.18 |
General Wastes
Industrial Wastes
Recycling
Paper
Water Use
|
Scope |
FY2024 | FY2025 | FY2026 | |
|---|---|---|---|---|
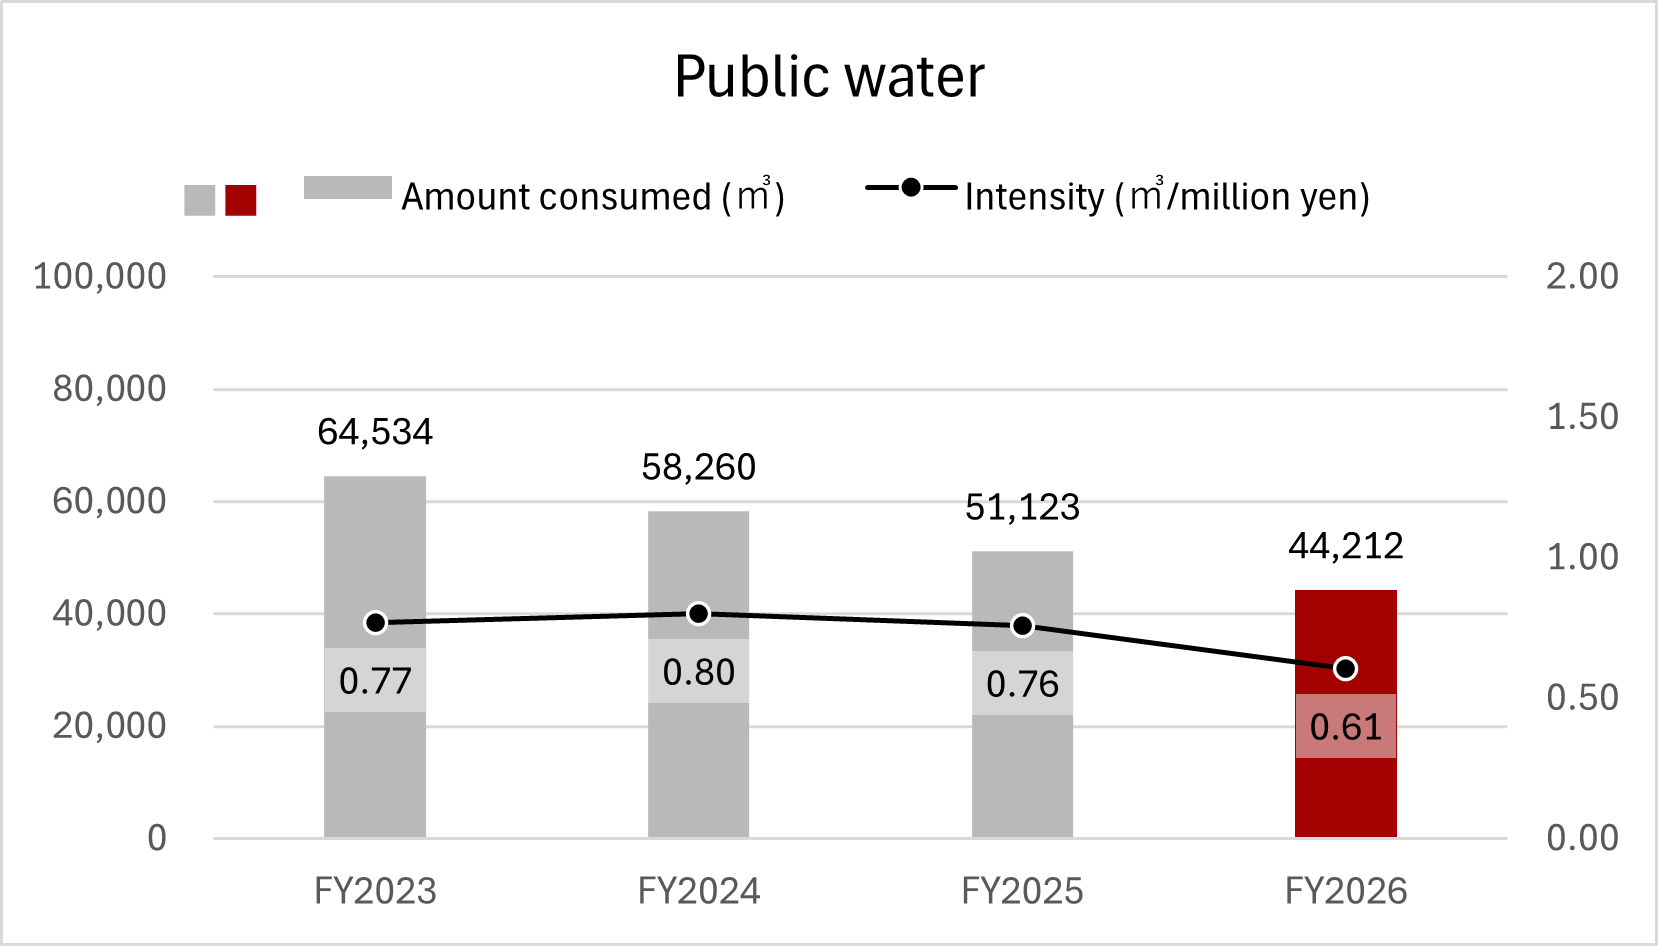
| Public water consumption (m3) / intensity(m3/million yen) | Consolidated | 58,260 / 0.80 | 51,123 / 0.76 | 44,212 / 0.61 |
| Industrial water consumption (m3) | 2,997 | 2,568 | 2,177 | |
| Groundwater consumption (m3) | 0 | 0 | 0 |
Public Water
Environmental Accounting
In order to promote the initiative on environmental conservation efficiently and effectively, we measure the costs and effects of overall environmental activities as quantitatively as possible and strive to continuously improve environmental performance.
Environmental Conservation Costs (Unit: million yen)
| Category | Scope | FY2024 | FY2025 | FY2026 | ||||
|---|---|---|---|---|---|---|---|---|
| Investment | Expense | Investment | Expense | Investment | Expense | |||
| 1. Costs in business area | Non-consolidated | 133 | 72 | 13 | 78 | 0 | 79 | |
| 2. Upstream / downstream costs | 0 | 0 | 0 | 0 | 0 | 0 | ||
| 3. Management activity costs | 0 | 10 | 0 | 8 | 5 | 8 | ||
| 4. Research and development costs | 0 | 297 | 0 | 161 | 0 | 333 | ||
| 5. Social activity costs | 0 | 0 | 0 | 0 | 0 | 0 | ||
| 6. Environmental damage costs | 0 | 0 | 0 | 0 | 0 | 0 | ||
| Total | 133 | 379 | 13 | 247 | 5 | 420 | ||
Environmental Conservation Effects
*▲ indicates that it has increased compared to the previous year.
*Water resource input includes public water, groundwater and industrial water.
| Category | Environmental performance indicators | Scope | FY2024 | FY2025 | FY2026 | Reduction effect | |
|---|---|---|---|---|---|---|---|
| (1) Environmental conservation effects related to the resources used for business activities | Total energy input (GJ) | Non-consolidated | 85,095 | 79,573 | 77,644 | 1,929 | |
| Water resource input (m3) | 22,327 | 18,981 | 17,894 | 1,087 | |||
| (2) Environmental conservation effects against environmental impacts and waste resulting from business activities | Greenhouse gas emissions (t-CO2) | 2,901 | 2,634 | 3,216 | ▲ 582 | ||
| Total waste emissions (t) | 170 | 114 | 105 | 9 | |||
Economic Effects of Environmental Conservation Measures (Unit: million yen)
| Scope | FY2024 | FY2025 | FY2026 | ||
|---|---|---|---|---|---|
| Reduction in expense | Non-consolidated | -26 | 2 | 13 | |
| Profit (recycling, etc.) | 46 | 31 | 49 | ||
| Total | 20 | 33 | 63 | ||
Calculation Method
Environmental conservation costs and effects are calculated in accordance with the Environmental Accounting Guidelines (2005 version). An in-house “Environmental Accounting Procedure Manual” was created based on the guidelines. The effects of environmental conservation measures are calculated by comparing the adjusted sales to the previous fiscal year based on the procedure manual.
Decent Work
| FY2024 | FY2025 | FY2026 | |||
|---|---|---|---|---|---|
| Number of employees taking childcare leave | Non-consolidated | Male | 9 | 13 | 18 |
| Female | 4 | 8 | 7 | ||
| Overall | 13 | 21 | 25 | ||
| Rate of employees taking childcare leave | Non-consolidated | Male | 100% | 92.30% | 100% |
| Female | 100% | 100% | 100% | ||
| Overall | 100% | 95.00% | 100% | ||
| Number of days of parental leave taken by male | Non-consolidated | Male | 30 | 86 | 45 |
| Rate of employees returning to work after childcare leave | Non-consolidated | Overall | 100% | 100% | 100% |
| Re-employment rate among mandatory retirees | Non-consolidated | Overall | 88.89% | 81.10% | 75.00% |
| Number of employees taking family nursing leave | Non-consolidated | Male | 1 | 0 | 0 |
| Female | 0 | 0 | 0 | ||
| Overall | 1 | 0 | 0 | ||
| Annual paid leave | Non-consolidated | Number of days taken | 15.6 | 15.6 | 15.1 |
| Rate of days taken | 81.80% | 76.80% | 72.58% | ||
| Consolidated | Rate of days taken | 86.74% | 84.22% | 87.31% |
Human Resource Attraction and Development
| FY2024 | FY2025 | FY2026 | ||
|---|---|---|---|---|
| Average per capita education and training hours | Non-consolidated | 10.4 (hours) | 9.2 (hours) | 9.5 (hours) |
| Average per capita education and training costs | Non-consolidated | 59(thousand yen) | 55 (thousand yen) | 98 (thousand yen) |
| Education and training hours required for next-generation executive training | Non-consolidated | 4,256 (hours) | 642.46 (hours) | 421.5 (hours) |
| Education and training costs required for next-generation executive training | Non-consolidated | 7,657 (thousand yen) | 5,946 (thousand yen) | 6,433 (thousand yen) |
| Safety Assessor training | Non-consolidated | 341 (hours) | 295 (hours) | 244 (hours) |
Employee Engagement
| FY2020 | FY2023 | FY2026 | |||
|---|---|---|---|---|---|
| Response rate of employee engagement survey | Domestic | 92% | 86.9% | 90.8% | |
| Score of employee engagement survey | Overall Attractiveness of the Company | 3.01 | 3.12 | 2.94 | |
| Overall Attractiveness of the Workplace | 3.12 | 3.16 | 3.10 | ||
* The survey is rated on a 5-point scale, with 4 to 5 being positive answers, and is conducted once every three years.
Labor Productivity
| FY2024 | FY2025 | FY2026 | ||
|---|---|---|---|---|
| Performance per employee | Consolidated | 23,554 (thousand yen) | 22,942 (thousand yen) | 24,274 (thousand yen) |
Governance
Directors
| As of June 2024 General Meeting of Shareholders |
As of June 2025 General Meeting of Shareholders |
As of June 2026 General Meeting of Shareholders |
||
|---|---|---|---|---|
| Number of directors (non-consolidated) |
Inside | 4 | 3 | 4 |
| Outside | 6 | 6 | 6 | |
| Number of female directors (non-consolidated) |
Inside | 0 | 0 | 0 |
| Outside | 3 | 3 | 3 | |
| Ratio of outside directors (non-consolidated) |
60% | 67% | 60% | |
| Ratio of female directors (non-consolidated) |
30% | 33% | 30% | |
Board of Directors
| FY2024 | FY2025 | FY2026 | ||
|---|---|---|---|---|
| Number of meetings | 7 | 7 | 7 | |
| Average attendance rate of directors | 99% | 100% | 100% | |
Stock Information
Click here for stock information such as total number of shares, number of shareholders, and rating information.
Compliance and Labor Practices
| FY2024 | FY2025 | FY2026 | |||
|---|---|---|---|---|---|
| Number of serious legal violations | Consolidated | 0 | 0 | 0 | |
| Number of internal reporting cases | 4 | 18 | 11 | ||
| Number of harassment reports / consultations | 4 | 4 | 4 | ||
| Participation rate of compliance and human rights related training | Non-consolidated | 100% | 100% | 100% | |
Anti-Corruption
| FY2024 | FY2025 | FY2026 | |||
|---|---|---|---|---|---|
| Bribery-related fines, penalties, or settlements (yen) | Consolidated | 0 | 0 | 0 | |
| Political contributions (yen) | 0 | 0 | 0 | ||
| Disciplinary dismissals for involvement in corrupt practices | 0 | 0 | 0 | ||
Safety
Occupational Health and Safety
| FY2024 | FY2025 | FY2026 | ||
|---|---|---|---|---|
| Number of occupational accidents | Non-consolidated | 9 | 4 | 0 |
| Number of deaths due to occupational accidents | Non-consolidated | 0 | 0 | 0 |
|
Rate of occupational accidents (Number of accident victims taking leave / Total working hours) |
Non-consolidated | 0.65 | 0.68 | 0 |
| Number of industrial health physicians and public health nurses | Non-consolidated | 7 | 6 | 6 |
| Monthly average overtime hours | Non-consolidated | 5.5 | 7.9 | 9.8 |
The IDEC Group has not experienced any serious occupational accidents, including fatal accidents involving employees and contract workers globally.
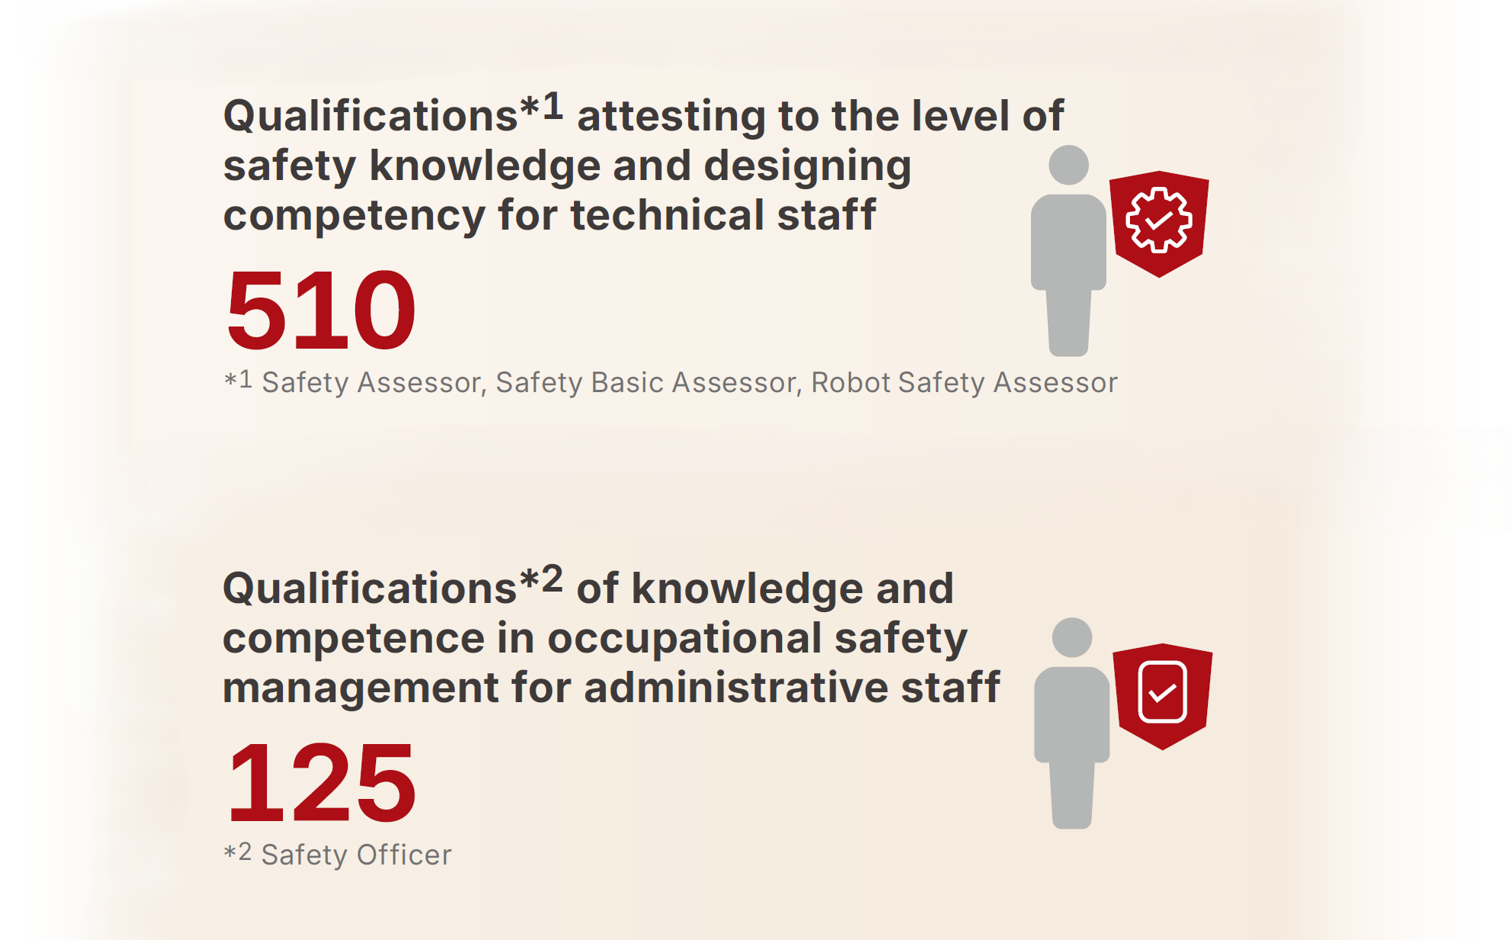
Safety Qualifications (as of March 2025)
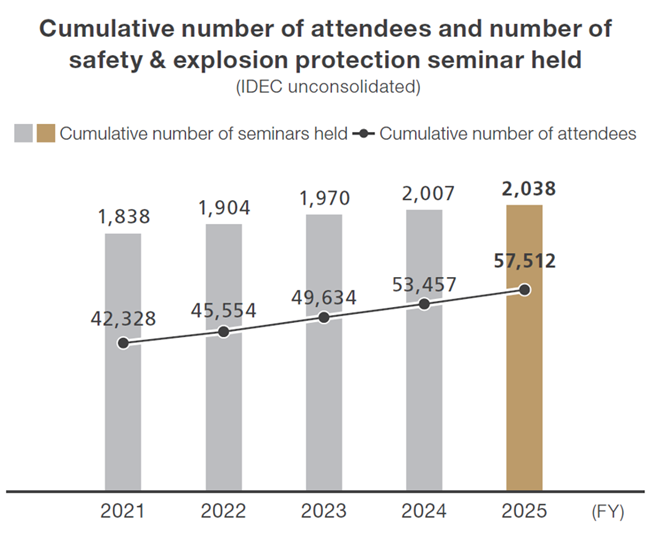
Number of Attendees of Safety and Explosion Protection Seminars
Quality
Quality Management and Quality Control Examination*
Number of grade holders of the Quality Management and Quality Control Examination®: 527
(Employees and associate employees of IDEC and its subsidiaries as of March 2026)
|
|
Grade 1 | Grade Pre-1 | Grade 2 | Grade 3 | Grade 4 | Total | |
|---|---|---|---|---|---|---|---|
| Number of holders | 2 | 6 | 50 | 349 | 120 | 527 | |
* The Quality Management and Quality Control Examination® is a registered trademark of the Japanese Standards Association.
This content is not endorsed, recommended, or reviewed by the Japanese Standards Association.
* Some past fiscal year data has been corrected.
Social
Diversity, Equity & Inclusion
(Regular employment)